


I'm experimenting with my big data. Hoping to get some feedback from here
I figured the easiest way was to just make a blog and attach screenshots of charts along with descriptions. Ideally I would love to have an interactive website with dropdown menus that create filtered dynamic reports. But I don't have that kind of reporting or website ability. So I went with simple.
And I figured posting images there might be easier and give me more flexibility. Would love to hear what kind of insights you would find interesting. I have data on every FBS team over 11 years and 8,000+ games. I have game data, spreads, totals, coaches, tv channel, viewership, conference, home/away, day of game, time of game, and more.
** Edited by HokieAl at 3/26/2026, 11:42:32 PM
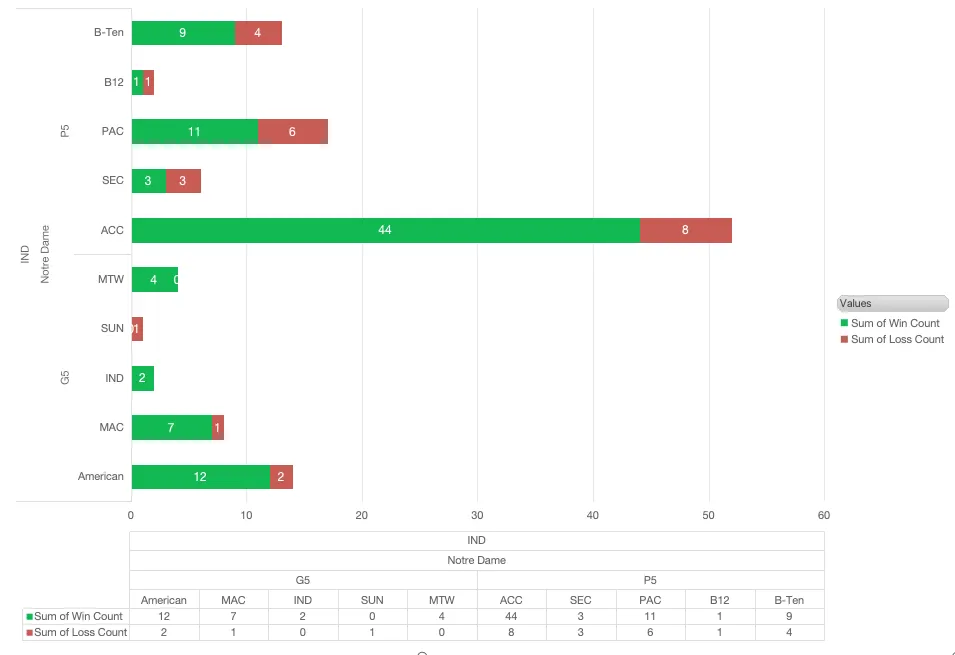
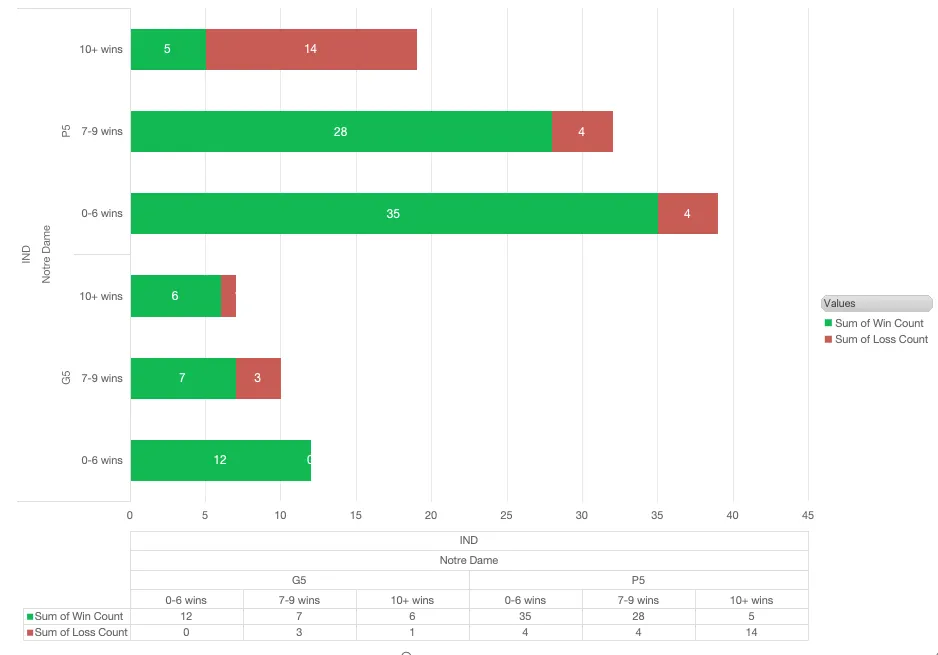
2 Replies
4mo
from data, stats, charts, and records. But they can generate surprising insights and maybe provoke some new conversations. Thanks for all the good work.
(In response to this post by HokieAl)
4mo
There are so many ways to filter and present the data. And I know that a lot of people don't like to look at raw data. So I'm trying to build a story around what i'm seeing. And hopefully I'll answer some of the questions that people here have been asking.
As always, happy to get feedback on this or requests. And feel free to request anything because I have a ton of data and just might have what you want.
Link:
ACC deep dive
(In response to this post by 33laszlo99)