Every year, Randy Jones produces a detailed report and analysis of Virginia Tech Athletics finances for TechSideline.com, with data culled from published NCAA reports on the Virginia Auditor of Public Accounts (APA) web site.
We just ran the tenth installment of Randy's report, meaning that we now have a decade's worth of data on VT athletic finances (more, actually; Randy's original 2004-05 report included data going back to 1999-2000).
Here's a link to all of Randy's reports, which we run as TSL Pass subscriber features:
VT Athletics Financial Reports
The reports are awesome and full of detail, and this year, we enlisted TSL infographics guru OXVT (follow him on Twitter, if you haven't heard us say that before) to produce a few simple charts to include in the report.
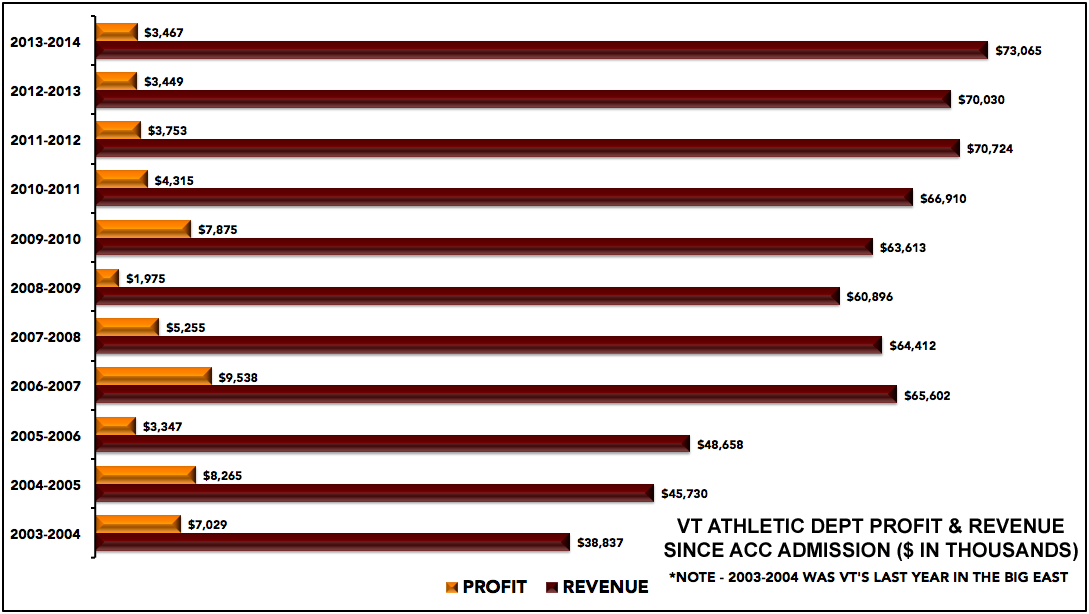
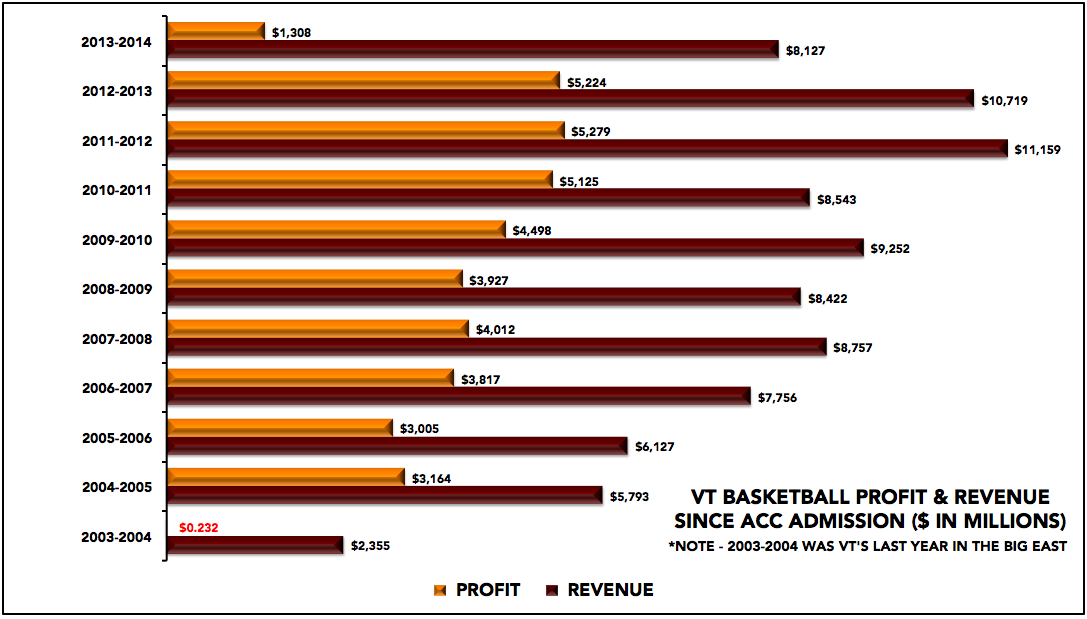
OX's charts show revenues and profits (as reported by Virginia Tech) for the last eleven years, dating back to VT's final year in the Big East, for the athletic department as a whole, and for football and men's basketball.
As always ... click for a larger version.