

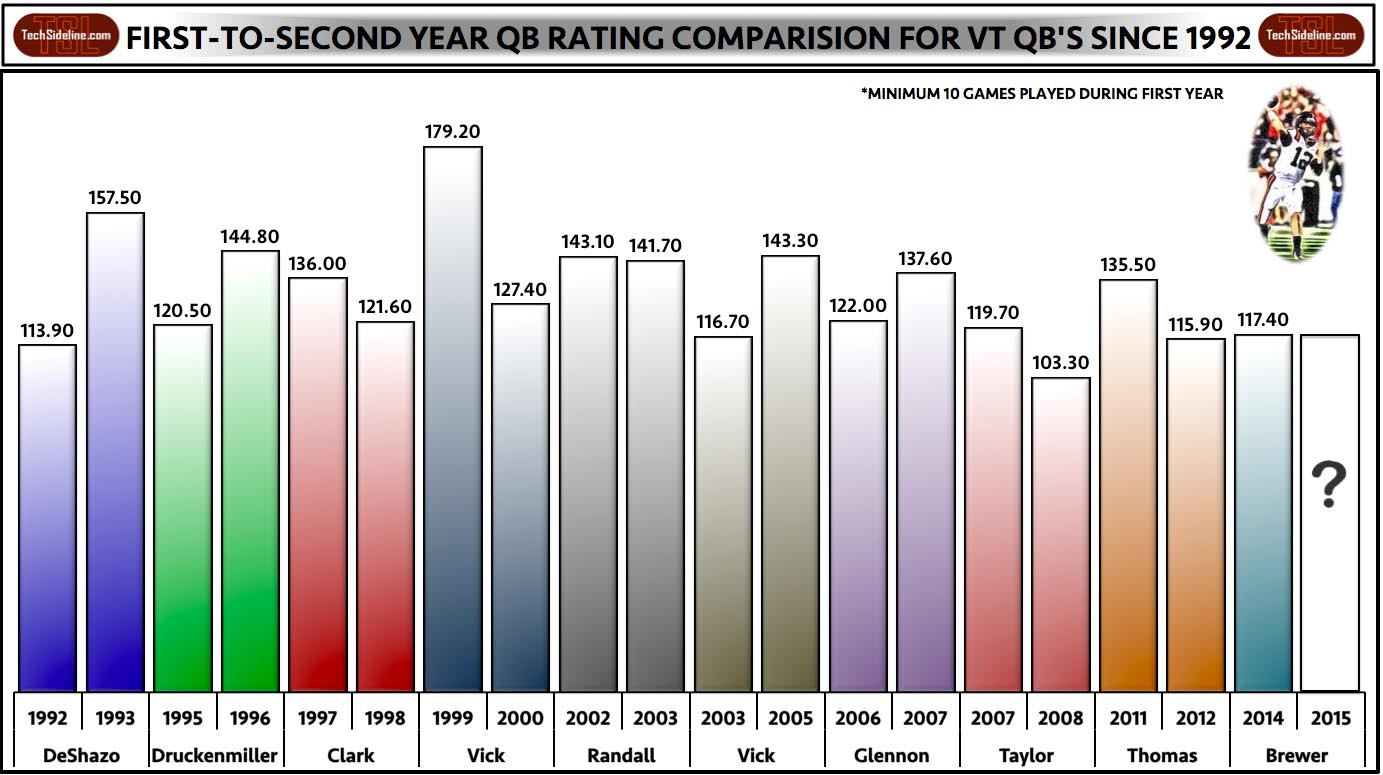
This recent infographic by OXVT on Twitter caught my eye. (Of course, they all do.) He charted efficiency ratings for Virginia Tech QBs since 1992, from year one to year two of a QB's tenure.
That got me to wondering: what can we expect from Michael Brewer this year, in his second season as Virginia Tech's starting QB?
Yes, I'm actually going to project what I think Brewer's numbers will be, and this projection will be the optimistic case, based on how some past VT quarterbacks have improved from year 1 to year 2.
Let's start with the OXVT infographic above. He covers nine quarterbacks in the Beamer Bowl Era (other than Brewer):
- 1992-93 Maurice DeShazo
- 1995-96 Jim Druckenmiller
- 1997-98 Al Clark
- 1999-2000 Michael Vick
- 2002-03 Bryan Randall
- 2003 and 2005 Marcus Vick
- 2006-07 Sean Glennon
- 2007-08 Tyrod Taylor
- 2011-12 Logan Thomas
I'm going to use the numbers of the above QBs to project what we hope Michael Brewer will do in 2015. But first, I have to whittle the list down to guys that I think are valid comparisons to Brewer 2014-15.
Step 1: Eliminate the Guys Who Got Worse From Year 1 to Year 2
I think Michael Brewer's efficiency will improve in 2015, versus 2014. He's much more familiar with the VT offense (he took a crash course in the summer of 2014 before being thrown out there), he was the Most Improved Offensive Player this past spring, and as Chris Coleman detailed in his interesting breakdown of the offensive players' experience going into 2015 vs. 2014, Brewer will be surrounded by much more experienced players who, like him, know the offense a lot better this year than they did last year.
Not to mention the injuries the Hokies suffered in 2014. Surely that can't happen again … right?
In any event, all signs point towards an improved Michael Brewer in 2015 vs. 2014. So get rid of Al Clark, Michael Vick, Tyrod Taylor, and Logan Thomas from the above list. Their efficiency ratings all dropped in their second year, and I don't think that'll happen with Brewer.
That leaves:
- 1992-93 Maurice DeShazo
- 1995-96 Jim Druckenmiller
- 2003 and 2005 Marcus Vick
- 2006-07 Sean Glennon
Step 2: Eliminate the Guys Who Weren't Full-time Starters
I believe that for the second year in a row, Brewer is going to be the full-time, uncontested starter at the QB position. So let's eliminate the guys on OXVT's infographic who weren't full-time starters.
I'm looking at you, Marcus Vick.
Marcus Vick played in 11 games in 2003, but he didn't start any of them, and he only had 57 passing attempts on the year, so remove him from consideration.
Sean Glennon started all 13 games in 2006 and 9 in 2007. Yes, Tyrod started 5 games in 2007, but Glennon started enough games -- plus, his efficiency rating improved -- that I want to keep him in the comparison.
That leaves 1992-93 DeShazo, 1995-96 Druckenmiller, and 2006-07 Glennon as players we'll use to project Michael Brewer's 2015 numbers.
That's not much, considering that we're talking about 20 years of football, but humor me.
Step 3: Project Attempts, Completions, Yards, TDs, and INTs
I'm going to project Brewer's QB rating for 2015. The QB Rating Calculator that I use requires just five data points of input: Attempts, Completions, Yards, TDs, and INTs.
In 2014, Brewer completed 262 of 441 passes for 2,692 yards, 18 TDs, and 15 INTs.
Passing attempts: We have no way to project this, so let's just assume that Brewer is going to throw about as many passes as he did last year: 441. That's a lot -- a school record as a matter of fact, breaking Logan Thomas' 2012 record of 429 attempts.
Let's ratchet that down a bit, in the hopes that VT will have an improved rushing attack and take some of the burden off Brewer. Let's project Brewer to throw 400 passes, which is still a high number, in 13 games in 2015. If the Hokies make the ACC Championship Game, that number will go up … or maybe 400 is perfect. We'll go with it.
Projected attempts: 400
Completions: last year, Brewer completed 59.4% of his passes, for a school-record 262 completions.
Here are the completion percentage improvements for DeShazo, Druckenmiller, and Glennon, going from year 1 to year 2:
- DeShazo, Druck, Glennon, year 1: 52.2%
- DeShazo, Druck, Glennon, year 2: 57.9%
- Improvement: +5.7%
Will Brewer improve by almost 6% on an already-solid (by Virginia Tech standards) 59.4%? Probably not. DeShazo's improvement is a bit of an anomaly, because he had a terrible percentage in 1992 (47.0%), and he improved to 56.1% in 1993, a jump of 9.1%. That throws off the average (Druck and Glennon improved by 5.1% and 4.6% respectively).
So let's project Brewer to improve by a more conservative 5%. That would be impressive and would give him a 64.4% completion percentage in 2015, breaking the record of 63.7% set by Bryan Randall in 2002.
Based on 400 attempts, a 64.4% completion rate gives us …
Projected completions: 258
Yards: Since we have no way to tell, let's just assume that Brewer's 258 completions will earn the same yards-per-completion that his 262 completions in 2014 did. That would give him 2,651 yards passing in 2015, very similar to last year's 2,692.
Projected yards: 2,651
Now we're getting to the nitty-gritty, the statistics that often define whether a QB has a good season or a bad season: touchdowns and interceptions.
Touchdowns: The best way to project number of touchdowns is to examine the TD/ATT ratio.
Brewer had 18 TDs in 2014. That's not a great number, when you consider that he launched 441 passes. His TD/ATT ratio was 0.041, a mediocre-to-bad number when compared to the other QBs in the infographic. (Trust me, I ran the numbers, though I won't clog up this article with them).
Here's the improvement in TD/ATT ratio for DeShazo, Druck, and Glennon:
- DeShazo, Druck, Glennon, year 1: 37 TDs in 809 attempts, 0.046 TD/ATT
- DeShazo, Druck, Glennon, year 2: 51 TDs in 715 attempts, 0.071 TD/ATT
- Improvement: +0.025
DeShazo was a +0.040 improvement, Druck a +0.020, and Glennon a +0.015. Again, DeShazo throws off the numbers, because he was so much better in 1993. Let's go with a more-conservative +0.020 for Brewer, giving him a 2015 TD/ATT ratio of 0.061. That would give him 0.061 * 400 attempts …
Projected TDs: 24
That would tie the record set by Tyrod Taylor in 2010, a season in which TT played in the ACCG. So that's ambitous.
Interceptions: Just like touchdowns, we'll project this using INT/ATT ratios.
Brewer had 15 INTs in 2014, a ratio of 0.034.
Fun fact #1: Michael Vick's 1999 INT/ATT ratio was 0.033.
Fun fact #2: Brewer's 0.034 was better than 1992 DeShazo (0.051), 1995 Druck (0.038), and 2006 Glennon (0.036). If it seemed like Brewer threw a lot of interceptions, part of the reason was the sheer number of attempts (441), not an egregious INT/ATT ratio.
Here's the improvement in INT/ATT ratio for DeShazo, Druck, and Glennon:
- DeShazo, Druck, Glennon, year 1: 33 INTs in 809 attempts, 0.041 INT/ATT
- DeShazo, Druck, Glennon, year 2: 17 INTs in 715 attempts, 0.024 INT/ATT
- Improvement: -0.017
DeShazo was a -0.021 improvement, Druck a -0.017, and Glennon a -0.015.
A -0.017 improvement for Brewer would drop his INT/ATT ratio to 0.017. That would be the second-best ratio of all seasons shown in OXVT's chart. Only Al Clark, with a 0.016 INT/ATT ratio in 1997, did better.
So an interception ratio of 0.017 would be outstanding. Let's go with the more conservative 0.020 ratio, which would still be very, very good, second-best behind Clark's 1997 season.
0.020 INT ratio on 400 attempts gives us….
Projected INTs: 8
This may be a bit rosy, given all the passes Brewer throws, but we'll go with it.
Step 4: Summarize Projected Overall Numbers and Calculate Efficiency
Our projected numbers for Michael Brewer in 2015 are: 258-400 (64.4%), 2,651 yards, 24 TDs, 8 INTs.
Projected passing efficiency, per our calculator: 136.0
Last season, that would have finished #48 in the nation, right ahead of UNC's Marquise Williams (135.4). So we're not asking Brewer to set the world on fire, although the 24 TDs would tie a Tech single-season record and the 8 INTs would be an impressive number. For comparison's sake, Tyrod threw 24 TDs and 5 INTs on 315 attempts in his senior season in 2010.
How does that compare with the guys on OXVT's chart? Let's take another look. (Click the infographic for a larger version, if you need it.)
Again, a rating of 136 wouldn't be outlandish. There are seven better ratings than that on the graphic, and one that's the same (Al Clark, 1997).
Overly Optimistic? Time Will Tell
As I told you in the beginning, this projection is an optimistic, maybe even best-case scenario. But why not? The Hokies were extremely young and extremely injured on offense a year ago, and Brewer was in his first year starting, just a couple months after arriving on campus. So the potential for great improvement is definitely there.
Quarterbacks don't operate in a vacuum. They depend upon their teammates for success, and lack of a good supporting cast is part of what derailed Logan Thomas from improving between 2011 and 2012 (and 2013), and Al Clark between 1997 and 1998.
But all indications are that Michael Brewer's supporting cast is going to be better in 2015, if for no other reason than they won't be mostly freshman anymore, like they were in 2014. That could go a long way towards helping Brewer improve his numbers, beyond his own personal improvement. Injuries will play a big role, as well.
The bottom line is this: if Brewer and his teammates progress, if the Hokies stay relatively healthy, and if a few things break their way, the numbers here could become a reality. If they do, the Hokies have a great shot at winning the ACC Coastal Division for the first time since 2011 and returning to Charlotte for a shot at an ACC championship.
Follow TSL on Facebook and Twitter.