

 Text by Will Stewart, infographics by OXVT (follow him on Twitter here, and view all previous infographics updates on TSL here). Click all infographics for a larger version!
In part 2 of this week's infographics series, we will concentrate on the Hokie defense, and we'll examine its performance this season, as well as historically.
Bottom line? Bud's defense spent a record amount of time in the opponents' backfield.
Let's get to the details.
Playing behind the line of scrimmage
Let's lead with the biggie: Bud Foster's unit set a Virginia Tech record (in the Beamer era) for tackles for loss (TFL). Congratulations, fellas!
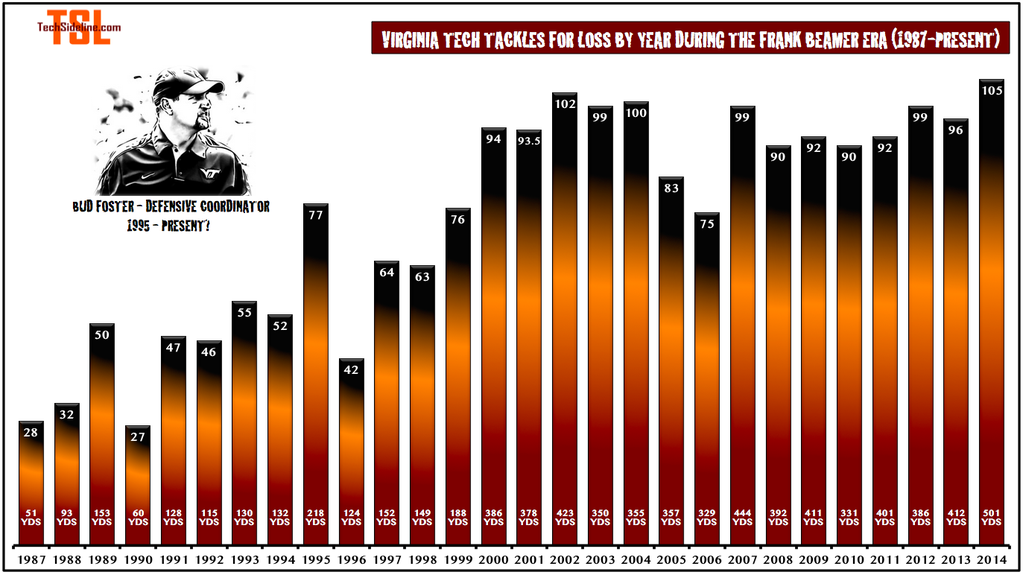
You might be thinking, "Sure ... but that's for 12 games. Some of those other years were only 11 games [every season prior to 2002 was only 11 games worth of stats, as bowl game stats were not included]. Did they REALLY set the record, from a TFL-per-game standpoint?"
So far, pending the bowl game, yes. The Hokies have averaged 8.75 TFL per game this season (105 TFL, 12 games), better than 2000 (94 TFL in 11 games, 8.54 per game), the next highest TFL-per-game season. If you're curious, 2002 was 14 games, 2003 was 13 games, 2007 was 14 games, etc.
If you add in bowl games, the Hokies had 101 TFL in 2000 and 100.5 in 2001, so this season is truly a new record for total TFL in a season, and is on record pace for TFL per game.
How about sacks?
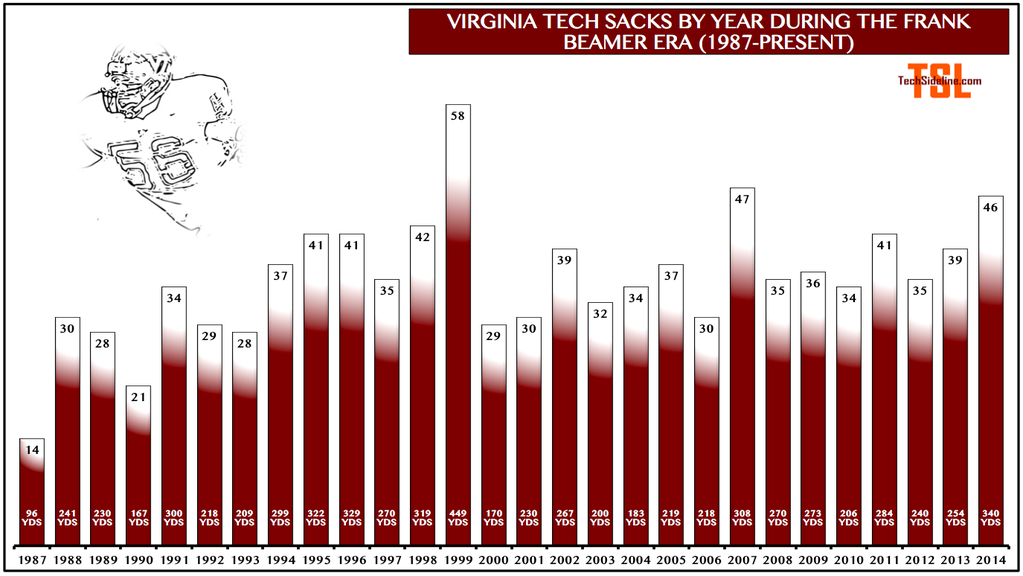
With two sacks in the bowl game, the Hokies will set the second-highest mark for sacks in the Beamer era. Note that the current #2, the 2007 season, was accomplished in 14 games.
Also, how about that 1999 season? That's 58 sacks in just 11 games. Wow. The Hokies added four more in the 1999 Sugar Bowl, for a total of 62 in 12 games. That record will stand, unless the Hokies sack Cincinnati 17 times in the Military Bowl.
Interceptions
This hasn't been one of Tech's better years for interceptions, though they still reached double figures with one more game to go. That's every season since 1988.
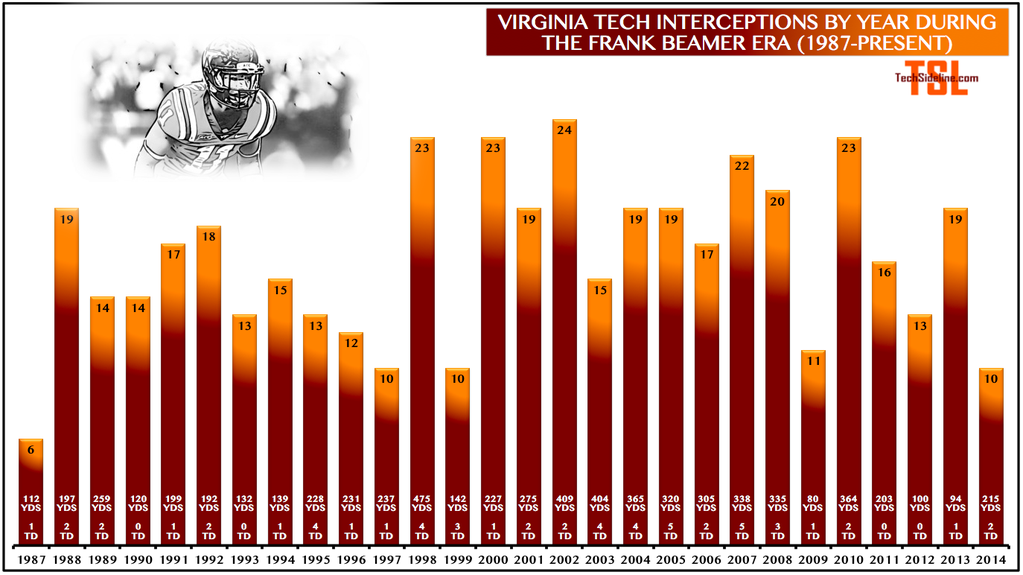
Just as important, VT continues to hold their lead in the category of most interceptions since the 2000 season. They still lead Oklahoma (12 so far this season) by 13 interceptions.

That's it for today's update, folks. We'll return tomorrow with some offensive infographics ... er, some infographics about the offense. They may or may not be offensive.
Many thanks to OXVT for the great infographics all season long! Follow him on Twitter, because that's a free way to express your gratitude.