

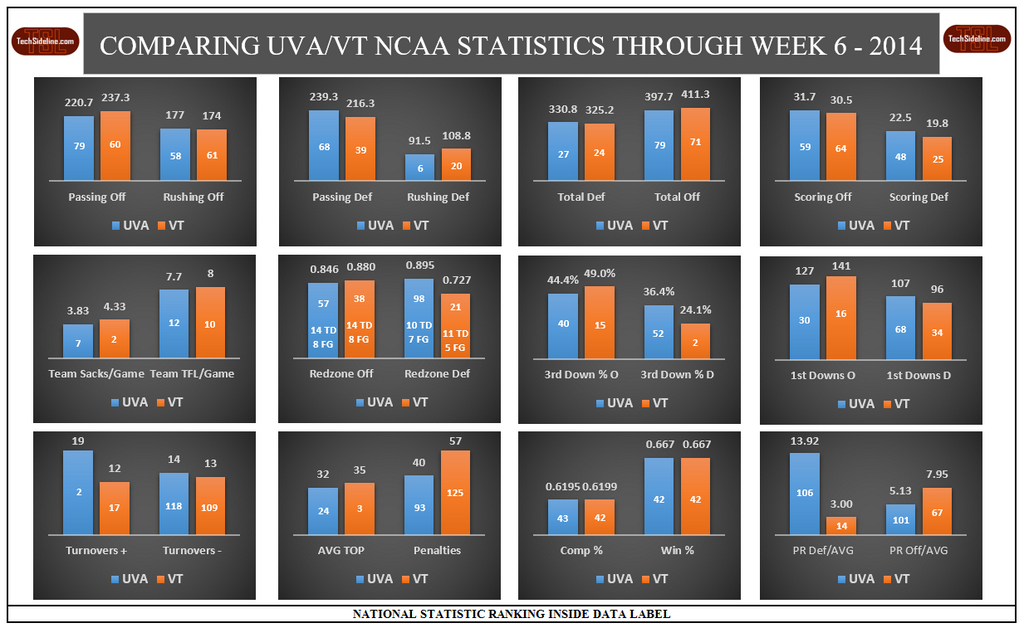
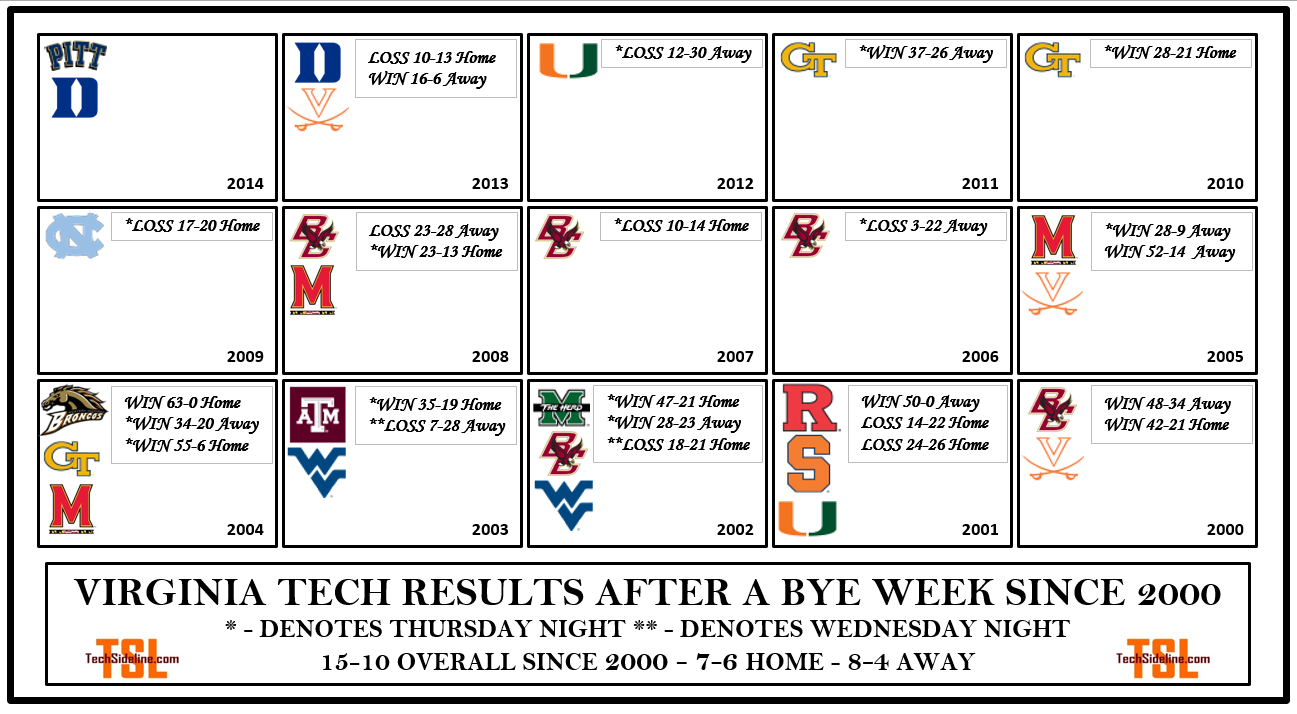
The latest infographics, including a statistical comparison between Tech and UVa (they're close!), and a look at Tech's results after a bye week dating back to the 2000 season.
To see all of OXVT's infographics, follow him on Twitter at @OX_VT. Follow TSL on Twitter at @TechSideline.
Great work by OXVT as always, and be sure to tweet your infographic requests to him on Twitter @OX_VT, or post them to our message boards.
CLICK EACH OF THE FOLLOWING INFOGRAPHICS TO SEE A LARGER, FULL-SIZED VERSION.
First, a look at how VT and UVa compare after the first six weeks of the college football season. They're eerily close in a lot of stats.
Next up is a look at how the Hokies have done in games after bye weeks, dating back to the 2000 season. It's not very good, considering Tech's overall record (136-49) during that same time frame of 2000-2013.
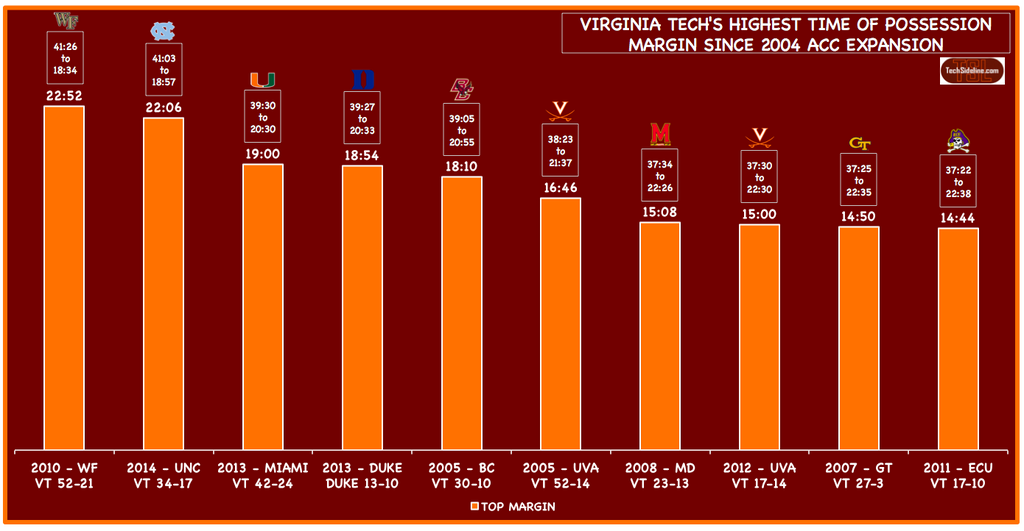
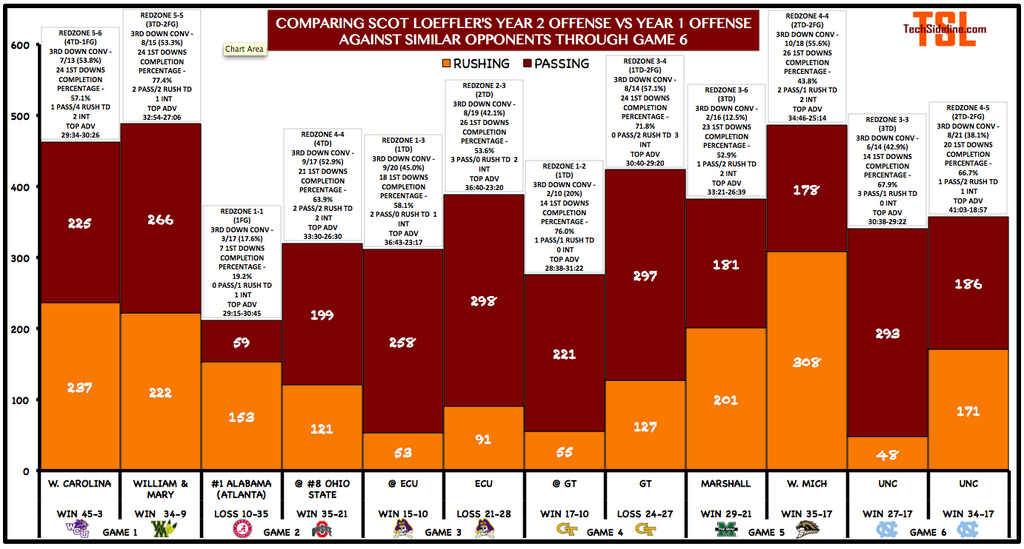
The Hokies recorded their second-best ever Time of Possession (TOP) stat under Frank Beamer (dating back to 1987) when they held the ball for 41:03 against UNC last weekend. Here's a look at Tech's top-ten TOPs since ACC expansion (we HATE the Duke 2013 stat).
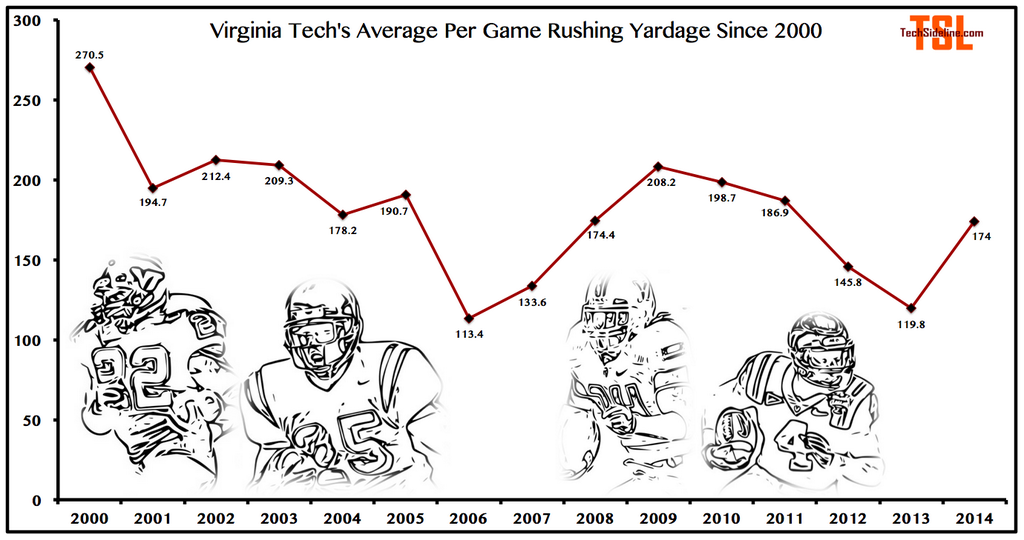
The Hokies aren't having a great year running the football, but it's not their worst ... here's a look at yards-per-game rushing since the 2000 season.
Speaking of running the football, here's a game-by-game breakdown of the tailbacks in 2014.

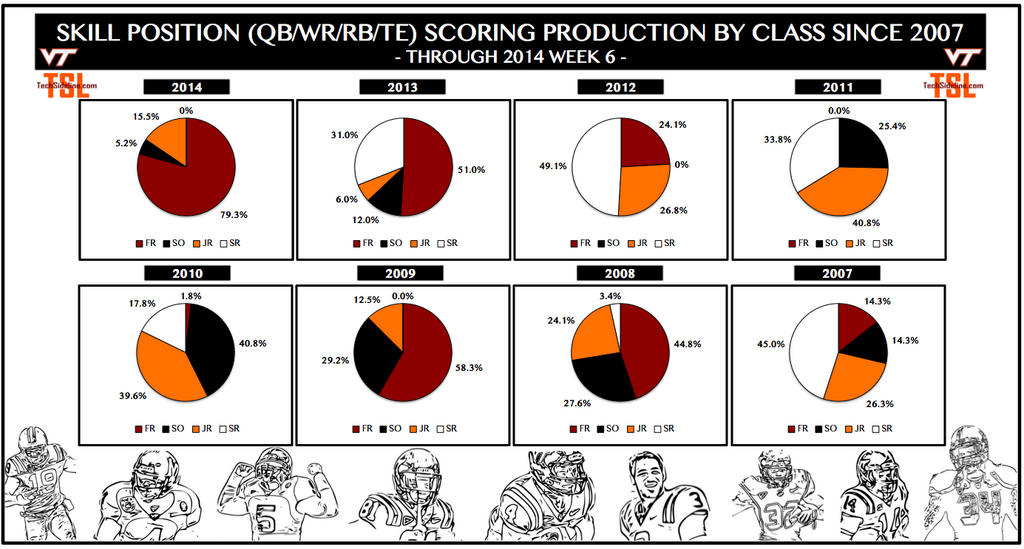
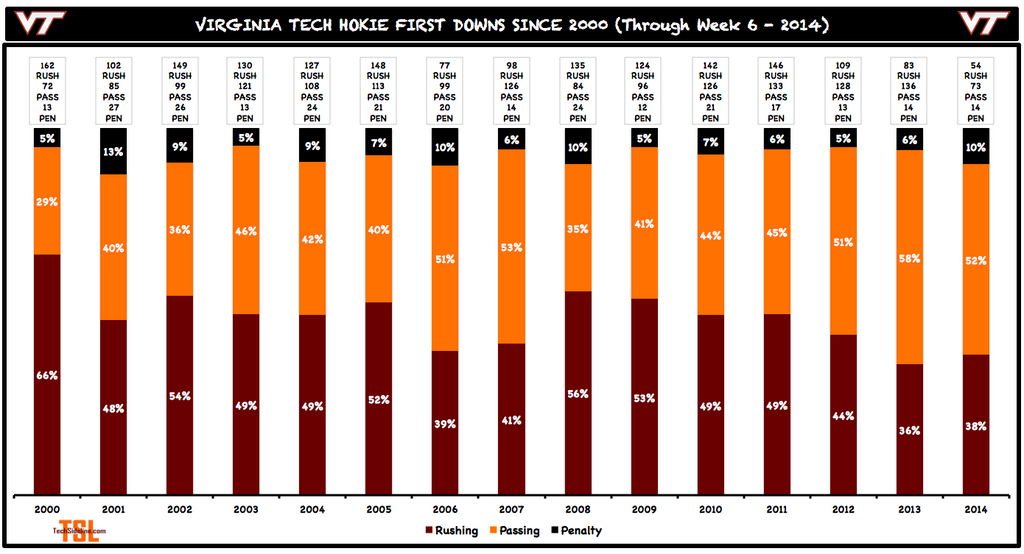
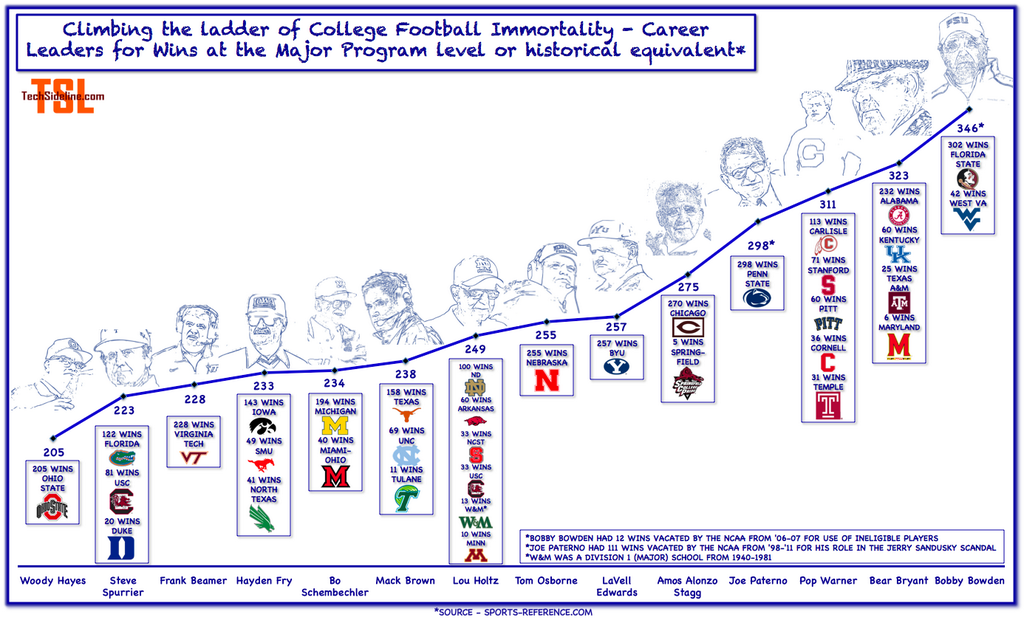
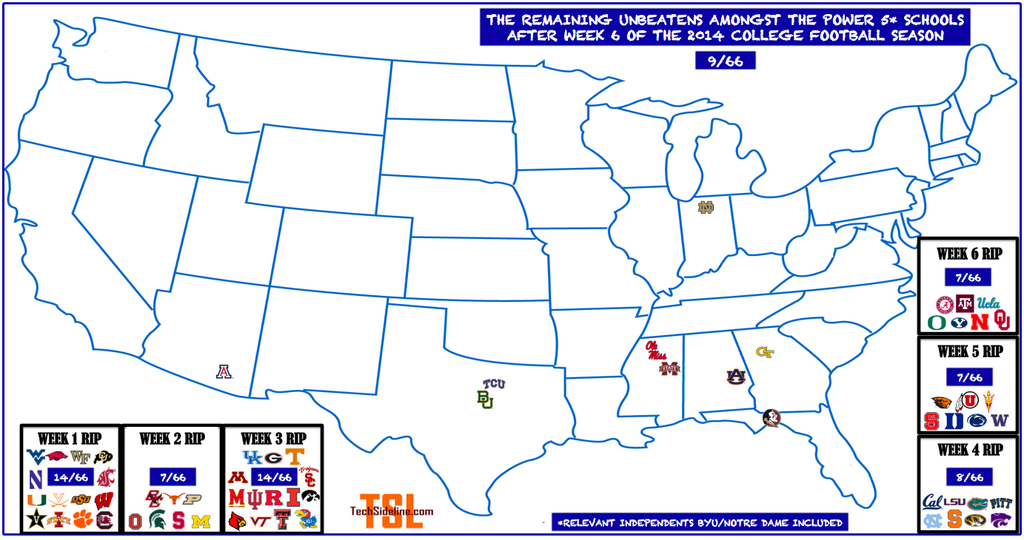
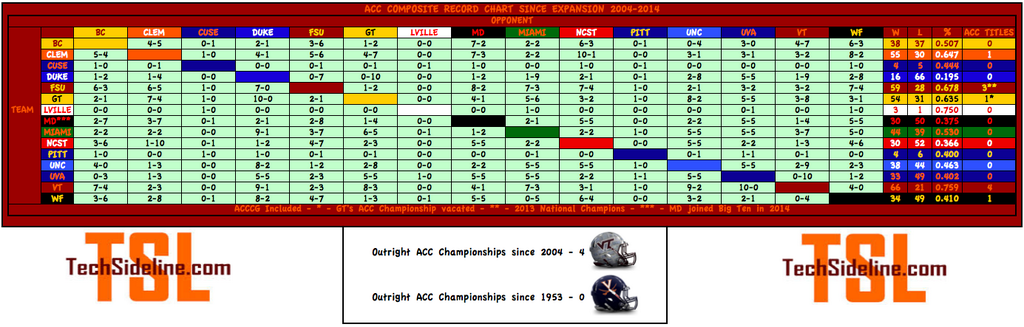
Lastly, the latest updated infographics that OXVT does on a week-by-week basis:


Many thanks to the hardest-working horned creature in Hokie football ... OXVT!