Sponsored by the Drive for 25: The Hokie Club's Drive for 25 campaign is a paid sponsor of TechSideline.com. As part of that sponsorship, we'll be bringing you monthly updates and articles about the Hokie Club and the Drive for 25. To learn more about the Drive for 25, click here.
 Recently, while writing my article about 2016 Power 5 Finances, I noticed that in the USA Today NCAA finances database, you could click on any school name to find out more detail about that school's finances not just in 2016, but dating all the way back to 2005.
When the article ran, some comments, both in the article itself and on the message boards, were aghast that West Virginia had a 2016 revenue figure of $105 million, compared to just $83 million for Virginia Tech. "How did WVU have $20 million more than the Hokies?" was the general question asked in multiple places.
So I screen-capped the details for both schools and created this graphic:

The graphic shows clearly how West Virginia far outpaced Virginia Tech in revenue. In 2016, WVU made $12 million more in Rights/Licensing revenue and $14 million more in Contributions. The Hokies made up some of the disparity back in student fees, but overall, West Virginia came out $22 million ahead in revenue.
The donation figure really jumped out at me, and it seemed like the next step was to record donation figures for every Power 5 school in the list and compare them to Virginia Tech.
The Pitfalls of the Donations Data (Don't Skip This Section)
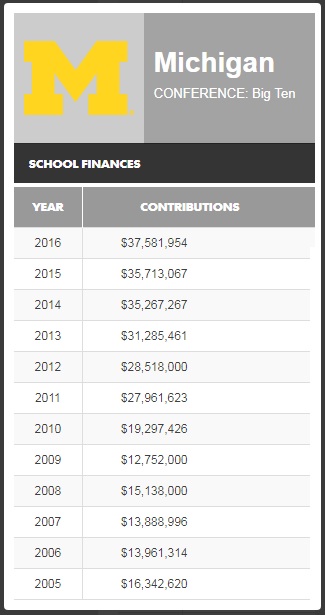
You have to be careful when comparing data in the USA Today reports, however. Randy Jones has been telling us for years in his annual financial reports that how schools report various financial figures varies, not just from school to school, but sometimes from year to year within the same school's reports.
With regards to donation levels that Virginia Tech has reported over the years, Randy notes: "Contributions reported will not agree to the annual information reports from the athletic fund raising numbers because only the applications of those amounts are presented. If the funds are not expended, they are generally not reported in the NCAA reports."
In other words, only the contributions that are spent are reported. So the Hokie Club might receive $25 million in donations in a given year, but if they only spend $19 million of that on scholarships and certain projects, then only $19 million is reported. Conversely, the Hokie Club could raise $23 million in a given year, but if, for example, a building project was finished and the Hokie Club made a large payment with funds that included money out of reserves, then perhaps a number like $27 million could be reported.
Looking at the reports from various schools, some schools' contribution levels as reported are relatively steady over the years, like for example Michigan:
But then some schools gyrate around, like Oregon:

In the Oregon figures, look at 2010 ($73.8 million) and 2014 ($124.9 million!). It looks like those were years that Oregon spent a lot of Phil Knight/Nike money on certain building projects.
Then there's Oklahoma State, who spent a lot of T. Boone Pickens money in 2006 ($211 million).
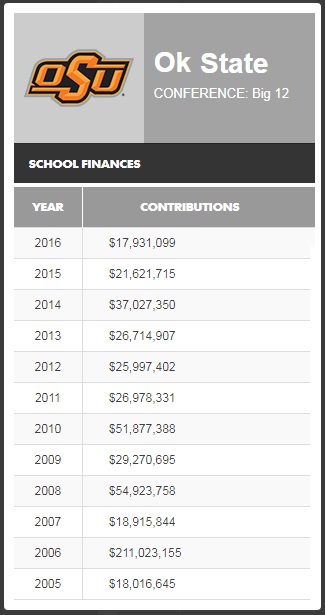
You can't draw sweeping conclusions about donation levels based on just one slice in time.
So I took the time to put all the data for 2005-2016 for each school into a spreadsheet, and then to average the data for the years presented (there was one exception: Penn State, which only reported 2010-2016).
So, for example, Virginia Tech's reported contributions from 2005-2016 were:
- 2005: $10,392,445
- 2006: $13,866,740
- 2007: $22,251,053
- 2008: $17,345,132
- 2009: $15,315,905
- 2010: $16,138,765
- 2011: $15,849,981
- 2012: $18,153,190
- 2013: $16,599,597
- 2014: $16,333,821
- 2015: $16,748,895
- 2016: $19,348,259
- Average: $16,528,649
I'm instantly suspicious about that data, because I know — though I can't find the data recorded anywhere on TSL — that Hokie Club contributions exceeded $20 million for a number of years in the mid-2000s. I was able to find this TSL article that reported 2004-05 donations of $24.2 million, way above the $10.3 million figure included above. That gets back to the discussion above about how figures are reported.
Having said all that, I think the figures in the NCAA Finances database on USA Today do paint a relative picture of contribution levels across Power 5 schools, especially when you average 12 years of data.
So what does that data say about where Virginia Tech ranks among Power 5 schools in contributions? Let's look.
Power 5 Contributions Data, 2005-2016
Let's get straight to the data, in table form.
| RANK | SCHOOL | CONF. | YEARS | AVE. CONTRIBUTIONS |
|---|---|---|---|---|
| 1 | Oklahoma State | Big 12 | 2005-2016 | $45,024,857 |
| 2 | Florida | SEC | 2005-2016 | $41,419,795 |
| 3 | Oregon | Pac 12 | 2005-2016 | $36,366,736 |
| 4 | Texas A&M | SEC | 2005-2016 | $35,531,118 |
| 5 | Texas | Big 12 | 2005-2016 | $35,418,190 |
| 6 | Auburn | SEC | 2005-2016 | $32,323,392 |
| 7 | LSU | SEC | 2005-2016 | $30,263,628 |
| 8 | Georgia | SEC | 2005-2016 | $29,700,737 |
| 9 | Alabama | SEC | 2005-2016 | $29,065,750 |
| 10 | Virginia | ACC | 2005-2016 | $26,644,370 |
| 11 | Tennessee | SEC | 2005-2016 | $25,572,038 |
| 12 | Ohio State | Big Ten | 2005-2016 | $25,262,684 |
| 13 | Kansas | Big 12 | 2005-2016 | $24,642,386 |
| 14 | Penn State* | Big Ten | 2010-2016 | $24,633,312 |
| 15 | Oklahoma | Big 12 | 2005-2016 | $24,577,267 |
| 16 | Iowa | Big Ten | 2005-2016 | $24,134,348 |
| 17 | Michigan | Big Ten | 2005-2016 | $23,975,644 |
| 18 | South Carolina | SEC | 2005-2016 | $23,641,991 |
| 19 | Wisconsin | Big Ten | 2005-2016 | $23,637,961 |
| 20 | Florida State | ACC | 2005-2016 | $23,216,237 |
| 21 | Michigan State | Big Ten | 2005-2016 | $21,901,968 |
| 22 | Louisville | ACC | 2005-2016 | $21,565,839 |
| 23 | Texas Tech | Big 12 | 2005-2016 | $21,151,475 |
| 24 | WVU | Big 12 | 2005-2016 | $19,167,257 |
| 25 | Arizona | Pac 12 | 2005-2016 | $18,847,689 |
| 26 | Washington | Pac 12 | 2005-2016 | $17,991,023 |
| 27 | Illinois | Big Ten | 2005-2016 | $16,575,714 |
| 28 | Virginia Tech | ACC | 2005-2016 | $16,528,649 |
| 29 | UNC | ACC | 2005-2016 | $16,470,629 |
| 30 | Kansas State | Big 12 | 2005-2016 | $16,331,284 |
| 31 | Clemson | ACC | 2005-2016 | $15,964,687 |
| 32 | Arkansas | SEC | 2005-2016 | $15,884,411 |
| 33 | California | Pac 12 | 2005-2016 | $15,677,896 |
| 34 | Missouri | SEC | 2005-2016 | $15,490,344 |
| 35 | Kentucky | SEC | 2005-2016 | $15,071,660 |
| 36 | Purdue | Big Ten | 2005-2016 | $14,393,017 |
| 37 | Indiana | Big Ten | 2005-2016 | $14,106,750 |
| 38 | Nebraska | Big Ten | 2005-2016 | $12,826,879 |
| 39 | Georgia Tech | ACC | 2005-2016 | $12,661,149 |
| 40 | Oregon State | Pac 12 | 2005-2016 | $12,314,910 |
| 41 | Arizona State | Pac 12 | 2005-2016 | $12,195,328 |
| 42 | Ole Miss | SEC | 2005-2016 | $11,701,354 |
| 43 | Maryland | Big Ten | 2005-2016 | $11,450,235 |
| 44 | UCLA | Pac 12 | 2005-2016 | $11,447,202 |
| 45 | Iowa State | Big 12 | 2005-2016 | $11,128,714 |
| 46 | Mississippi State | SEC | 2005-2016 | $10,958,512 |
| 47 | Colorado | Pac 12 | 2005-2016 | $10,377,293 |
| 48 | NC State | ACC | 2005-2016 | $9,605,338 |
| 49 | Minnesota | Big Ten | 2005-2016 | $8,368,446 |
| 50 | Rutgers | Big Ten | 2005-2016 | $7,451,606 |
| 51 | Washington State | Pac 12 | 2005-2016 | $6,980,052 |
| 52 | Utah | Pac 12 | 2005-2016 | $6,572,169 |
Per those figures, Virginia Tech ranked 28th out of 52 Power 5 schools in average contributions from 2005-2016. The Hokies ranked 4th among ACC schools. That's better than I expected.
Let's put the figures above in some context. I calculated the total revenue averages from 2005-2016 as well, and the Hokies ranked 35th out of the 52 Power 5 schools.
Not too bad, right? But note that by 2016, Virginia Tech had fallen to 41st in total revenue among those 52 schools, as I noted last week.
And in 2016 contributions, the Hokies were 36th, below their 12-year average of 28th. So things are trending down, not just in total revenue (because ACC schools are getting killed by conferences with networks, as I remarked last week), but in donations as well.
Random example of things trending the wrong way: you might find it interesting that Clemson, known as a fundraising powerhouse, ranks below the Hokies in 12-year donation averages, coming in at $15.9 million to VT's $16.5 million.
But from 2014-2016, Clemson reported total contributions of $75 million, versus $52.4 million for Virginia Tech.
The Importance of the Drive for 25 (and those per-seat minimums, too)
By the way, I think the $19.3 million in reported donations for 2016 is fairly accurate. In April, the Hokie Club reported record donations for FY2017 at about $33 million and noted that number was an increase of 65 percent over FY2016. Plug those numbers into your calculator, and you can back-calculate a figure of about $20 million for FY2016.
If the Hokies had raised $33 million in 2016 instead of $19.3 million, Virginia Tech's total revenue for FY2016 would have been $97.4 million, catapulting Virginia Tech from No. 41 in 2016 revenue all the way up to No. 30.
That's the kind of profound effect that simply donating can have.
There are certain revenue streams that aren't going to change overnight, or even over the years. There are schools that have football stadiums that seat over 90,000 fans, versus Virginia Tech's 65,000, and huge basketball coliseums versus Cassell Coliseum. The ACC Network, once it launches (don't get me started on that), will make up some of the media rights revenue issues the Hokies have, but most agree the ACCN won't be as lucrative as the SEC Network or Big Ten Network.
Phil Knight will always be an Oregon contributor. T. Boone Pickens is an Oklahoma State money fountain, and Kevin Plank and his $1.85 billion net worth will always be graduates of the University of Maryland (well, Kevin is; not his money).
Certain disparities will always exist. But if there's one area where Hokie fans can have an immediate impact, literally overnight, it's in Hokie Club contributions. If 1,000 Hokie fans decide to donate $100 a month to the Hokie Club — or $100 a month more — that's $1.2 million in new contributions and revenue, without having to wait on, say, John Swofford to properly manage the ACC's media rights.
The same thing happens if 2,000 Hokie fans decide to donate just $50 a month. And so on.
Writing these "Drive for 25" sponsored articles is an interesting exercise, from the standpoint that it can sound like I'm openly shilling for the Hokie Club. I admit that. But on the other hand, the numbers don't lie, and while the statement "The Drive for 25 is critical to the future of Virginia Tech athletics" may sound like an opinion, I would postulate that it's more fact than opinion. The more numbers I run, and the more I learn, the more I realize that.
The Hokie Club has rightly couched much of their recent work in terms of the Hokie Scholarship Fund, and the need to raise enough money to pay for athletic scholarships without having to dip into the operating revenue. But really, the Drive for 25 is a larger initiative that is about Virginia Tech athletics overall, not just scholarships, and is an effort to bring Hokie fans together to have a big impact on Virginia Tech's success on the fields of play.
If you want to know more about how Virginia Tech compares to its Power 5 brethren across all revenue streams, check out this page I set up that enables you to sort schools by ticket revenue, contributions, media rights, student fees, and more. It's interesting stuff:
Power 5 Finances, Per-School Averages, 2005-2016